GREAT RESULTS!
Targets
Academic performance is a major corner
stone at Goomeri State School. This is evident by the targets and expectations
placed on the students, individually and as a whole class. Each student has
individually negotiated and set; literacy, numeracy, SOSE and science targets
to achieve by the end of each year. Each class has more detailed targets,
including NAPLAN, PAT – R and PAT – M, which they are attempting to achieve by
the end of the year. Below are the individual data targets for each class.
Students also develop personal goals to go with the data targets.
English
|
|
Prep
|
1
|
2
|
3
|
4
|
5
|
6
|
7
|
8
|
9
|
10
|
|
PM
|
5
|
15
|
20
|
24
|
27
|
30
|
30
|
|
|
|
|
|
IPI
|
|
|
|
|
|
|
5
|
6
|
7
|
8
|
8
|
|
PAT-R
|
65
|
79
|
91
|
108
|
118
|
122
|
126
|
129
|
131
|
134
|
135
|
|
Magic
words
|
100
|
200
|
300
|
|
|
|
|
|
|
|
|
Mathematics
|
|
Prep
|
1
|
2
|
3
|
4
|
5
|
6
|
7
|
8
|
9
|
10
|
|
Acc
|
|
17
|
22
|
23
|
24
|
25
|
25
|
25
|
25
|
25
|
25
|
|
Speed
|
|
27
|
68
|
110
|
151
|
192
|
206
|
247
|
247
|
261
|
261
|
|
PAT-M
|
|
|
|
45
|
52
|
58
|
61
|
62
|
64
|
65
|
66
|
This information is communicated to the
community and discussions are encourage to take place at the regular parent
teacher interviews.
2014 NAPLAN – Snap Shot
- 100% of Year 3, 5 and 7 students are above the
National Minimum Standard (NMS) in reading, writing, grammar, punctuation
and numeracy for 2014.
- Years 3, 5, 7 and 9 produced results similar to the
national average for grammar, punctuation and numeracy in 2014.
- Years 3, 5 and 7 produced results similar to the National
average for reading and spelling in 2014.
- 33% of year 3 students, 28% of year 5 students, and
25% of year 7 students are in the top two bands for reading in 2014.
2014 NAPLAN – Reading
Goomeri State School students in years
3, 5, 7 and 9 should be congratulated on their excellent NAPLAN results in
reading. The school has placed a large emphasis on reading during the last 4
years and the results are very positive. This graph shows the class percentage
above the National Minimum Standard (NMS) and the nation’s percentage above the
National Minimum Standard. For example, 100% of the year 5 class is above the
NMS while 92% of year 5 students in Australian are above the NMS.
|
Year 3
|
Year 5
|
Year 7
|
Year 9
|
|
% of GSS students
above NMS
|
100
|
100
|
100
|
91
|
|
% of Nation above NMS
|
93
|
92
|
94
|
92
|
2014 NAPLAN – Writing
Goomeri State School students should be
congratulated on their excellent NAPLAN results in writing. The school has just
begun implementing the ‘7 Steps for Successful Writing’ and we are expecting
results to continue to improve. This graph shows the class percentage above the
National Minimum Standard (NMS) and the nation’s percentage above the National
Minimum Standard. For example, 100% of the year 7 class is above the NMS while
88% of year 7 students in Australian are above the NMS.
|
Year 3
|
Year 5
|
Year 7
|
Year 9
|
|
% of GSS students
above NMS
|
100
|
100
|
100
|
63
|
|
% of Nation above NMS
|
93
|
90
|
88
|
81
|
2014 NAPLAN – Mathematics
Goomeri State School students in years
3, 5, 7 and 9 should be congratulated on their excellent NAPLAN results in
Mathematics. The school places a very large emphasis on students knowing their
basic mathematics facts, such as number facts and strand specific mental
questions.
This graph shows the class percentage
above the National Minimum Standard (NMS) and the nation’s percentage above the
National Minimum Standard. For example, 100% of the year 3 class is above the
NMS, while 94% of year 3 students in Australian are above the NMS.
|
Year 3
|
Year 5
|
Year 7
|
Year 9
|
|
% of GSS students
above NMS
|
100
|
100
|
100
|
91
|
|
% of Nation above NMS
|
94
|
93
|
95
|
94
|
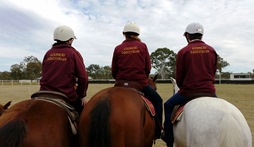
OUTSTANDING PERFORMANCES IN EQUESTRIAN
South Burnett Cow Horse Chal lenge
lenge
2013 Champion School
2014 Champion School
2015 Champion School
South Burnett Equestrian Competition
2012 Champion School
2014 Champion School
2015 Champion School